Weather Chart Analysis Worksheet Generator
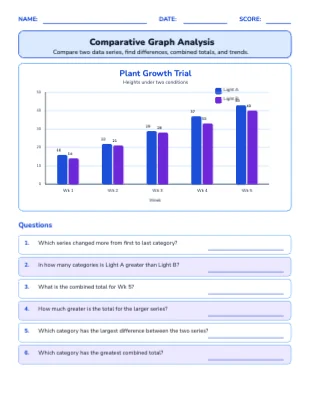
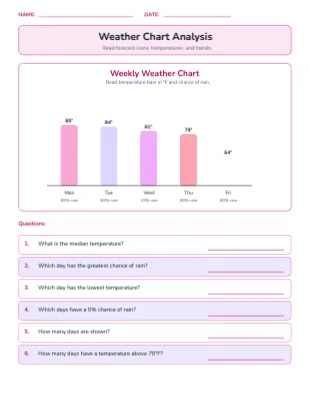
The Weather Chart Analysis generator produces worksheets built around a weekly weather forecast chart — complete with temperature bars, forecast icons, and precipitation percentages — followed by questions on reading values, calculating differences, identifying trends, and solving comparison problems. Cross-curricular in nature, this generator connects math data skills with science and real-world observation, making it engaging for Grades 3–6. Fresh chart data every time, complete with a full answer key.
Grade Levels
What's Included
Curriculum Standards
Interpret weather data displays and solve measurement and comparison questions.
Draw a picture graph and a bar graph (with single-unit scale) to represent a data set with up to four categories. S…
Draw a scaled picture graph and a scaled bar graph to represent a data set with several categories. Solve one- and …
Topics
Frequently Asked Questions
Is the Weather Chart Analysis worksheet generator free?+
Yes — sign up free and start generating Weather Chart Analysis worksheets right away. Paid plans add higher limits and premium features.
Does it include an answer key?+
Yes. Every Weather Chart Analysis worksheet is generated together with a matching answer key page, plus a teacher guide with objectives and extension ideas.
What grade levels is the Weather Chart Analysis generator for?+
It is designed for Grade 3 – Grade 6. You can adjust the difficulty and options to fit your students.
Can I customize the worksheets?+
Yes — every generated worksheet opens in the built-in editor, so you can change the title, instructions, fonts, colors, and layout before printing.
Can I make more than one version?+
Yes — each generate produces a fresh worksheet, so you can print unlimited unique versions for practice, homework, and assessments.