Venn Diagram Analysis Worksheet Generator
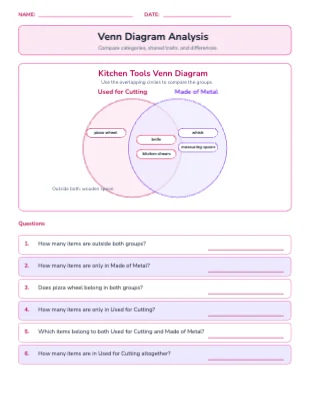
The Venn Diagram Analysis generator creates structured worksheets with a two-circle Venn diagram and a set of questions asking students to count items in each region, identify shared attributes, calculate totals, and compare categories. Venn diagrams are a powerful thinking tool across subjects — used in math for data classification, in science for comparing organisms, and in ELA for text comparison — making this generator versatile across Grades 3–6. Each worksheet uses a fresh dataset and includes a complete answer key.
Grade Levels
What's Included
Curriculum Standards
Draw scaled picture graphs and bar graphs to represent data sets; classify and compare categorical data.
Summarize numerical data sets in relation to their context and describe patterns of distribution.
Use Venn diagrams to classify, sort, and compare items by attributes and overlapping properties.
Draw a picture graph and a bar graph (with single-unit scale) to represent a data set with up to four categories. S…
Draw a scaled picture graph and a scaled bar graph to represent a data set with several categories. Solve one- and …
Topics
Frequently Asked Questions
Is the Venn Diagram Analysis worksheet generator free?+
Yes — sign up free and start generating Venn Diagram Analysis worksheets right away. Paid plans add higher limits and premium features.
Does it include an answer key?+
Yes. Every Venn Diagram Analysis worksheet is generated together with a matching answer key page, plus a teacher guide with objectives and extension ideas.
What grade levels is the Venn Diagram Analysis generator for?+
It is designed for Grade 3 – Grade 6. You can adjust the difficulty and options to fit your students.
Can I customize the worksheets?+
Yes — every generated worksheet opens in the built-in editor, so you can change the title, instructions, fonts, colors, and layout before printing.
Can I make more than one version?+
Yes — each generate produces a fresh worksheet, so you can print unlimited unique versions for practice, homework, and assessments.