Statistics & Data Analysis Worksheet Generator
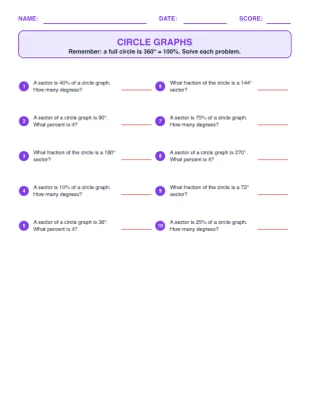
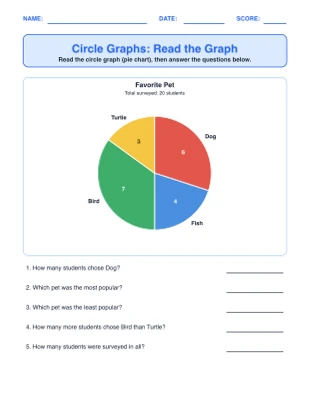
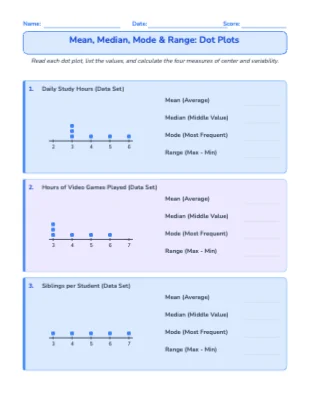
The Statistics & Data Analysis generator creates worksheets where students calculate mean, median, mode, and range from data displayed in three different formats — dot plots, stem-and-leaf plots, and frequency tables. Practising the same statistical measures across multiple data representations develops the flexible data-literacy skills required for Grades 6–8 and beyond. Answer key and teacher guide included.
Grade Levels
What's Included
Curriculum Standards
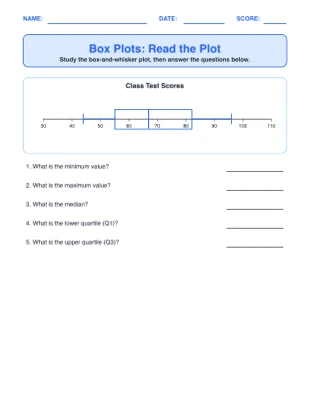
Display numerical data in plots on a number line, including dot plots, histograms, and box plots.
Summarize numerical data sets in relation to their context.
Topics
Frequently Asked Questions
Is the Statistics & Data Analysis worksheet generator free?+
Yes — sign up free and start generating Statistics & Data Analysis worksheets right away. Paid plans add higher limits and premium features.
Does it include an answer key?+
Yes. Every Statistics & Data Analysis worksheet is generated together with a matching answer key page, plus a teacher guide with objectives and extension ideas.
What grade levels is the Statistics & Data Analysis generator for?+
It is designed for Grade 6 – Grade 8. You can adjust the difficulty and options to fit your students.
Can I customize the worksheets?+
Yes — every generated worksheet opens in the built-in editor, so you can change the title, instructions, fonts, colors, and layout before printing.
Can I make more than one version?+
Yes — each generate produces a fresh worksheet, so you can print unlimited unique versions for practice, homework, and assessments.