Scatter Plots Worksheet Generator
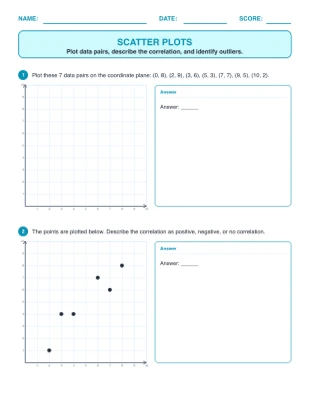
Scatter Plots builds bivariate data fluency on a coordinate plane (integer ticks, range 0–10). Activity modes plot a set of 6–8 given (x, y) data pairs, describe the correlation as positive/negative/no correlation from a trend, and identify the outlier in a near-linear cloud, with a mixed-review mode. Given points appear on both pages; the plotted-pairs answer geometry and the red answer text appear only on the key. Includes a red answer key and a teacher guide.
Grade Levels
What's Included
Curriculum Standards
CCSS Math 8.SP.A.1
Topics
Frequently Asked Questions
Is the Scatter Plots worksheet generator free?+
Yes — sign up free and start generating Scatter Plots worksheets right away. Paid plans add higher limits and premium features.
Does it include an answer key?+
Yes. Every Scatter Plots worksheet is generated together with a matching answer key page, plus a teacher guide with objectives and extension ideas.
What grade levels is the Scatter Plots generator for?+
It is designed for Grade 8. You can adjust the difficulty and options to fit your students.
Can I customize the worksheets?+
Yes — every generated worksheet opens in the built-in editor, so you can change the title, instructions, fonts, colors, and layout before printing.
Can I make more than one version?+
Yes — each generate produces a fresh worksheet, so you can print unlimited unique versions for practice, homework, and assessments.