Racing Car Speed & Time Graph Worksheet Generator
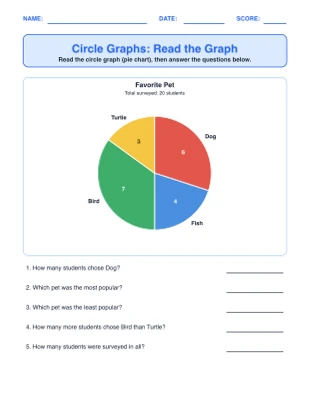
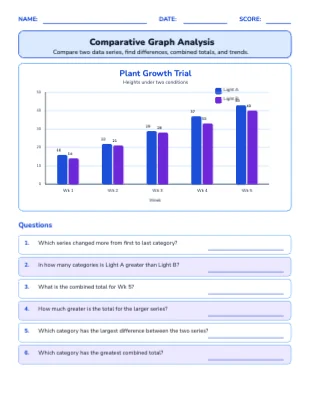
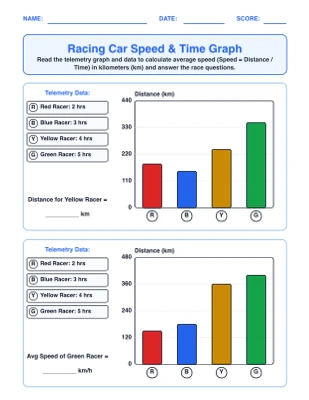
Each problem features a card frame with race car team telemetry data (Red Racer, Blue Racer, Yellow Racer, Green Racer), a clean bar chart or line graph showing distance (km), and a rate question answer line. Supports four question modes (Read Graph Distance, Calculate Average Speed, Determine Race Winner, and Mixed Question Mode); three graph display types (Bar Chart, Line Chart, and Mixed Graph); three difficulty levels (3 Cars, 4 Cars, and Decimal Time); and 2 or 4 problems per page. Complete with student pages, answer keys with exact calculated speeds and champion rankings in green, and five-section teacher guide.
Grade Levels
What's Included
Curriculum Standards
Calculate speed rates (v = s/t) and interpret bar and line data graphs.
Topics
Frequently Asked Questions
Is the Racing Car Speed & Time Graph worksheet generator free?+
Yes — sign up free and start generating Racing Car Speed & Time Graph worksheets right away. Paid plans add higher limits and premium features.
Does it include an answer key?+
Yes. Every Racing Car Speed & Time Graph worksheet is generated together with a matching answer key page, plus a teacher guide with objectives and extension ideas.
What grade levels is the Racing Car Speed & Time Graph generator for?+
It is designed for Grade 3 – Grade 6. You can adjust the difficulty and options to fit your students.
Can I customize the worksheets?+
Yes — every generated worksheet opens in the built-in editor, so you can change the title, instructions, fonts, colors, and layout before printing.
Can I make more than one version?+
Yes — each generate produces a fresh worksheet, so you can print unlimited unique versions for practice, homework, and assessments.