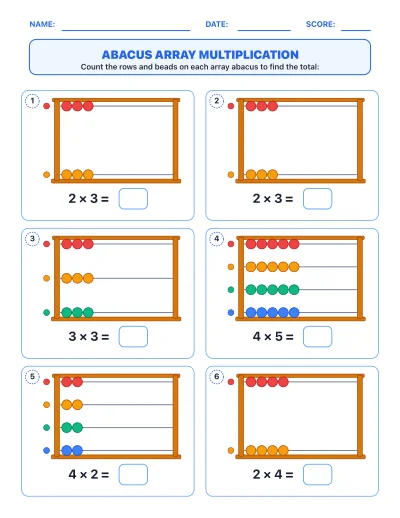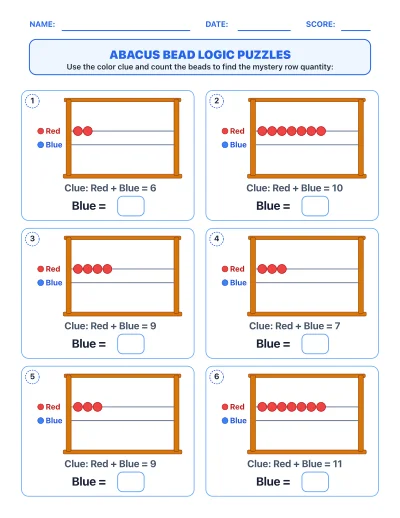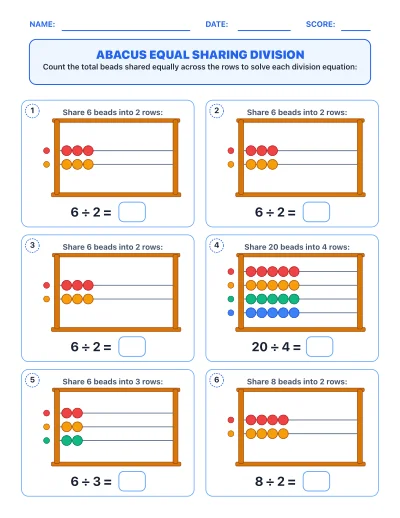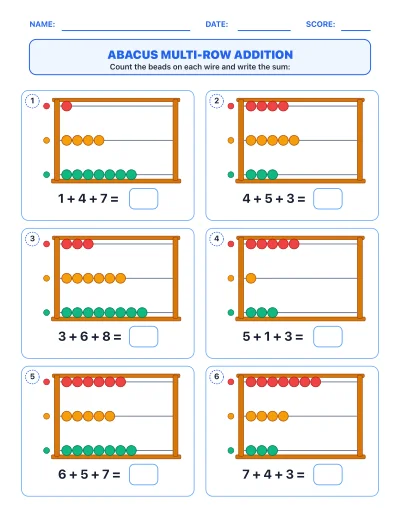
Line Plot / Dot Plot Analysis Worksheet Generator
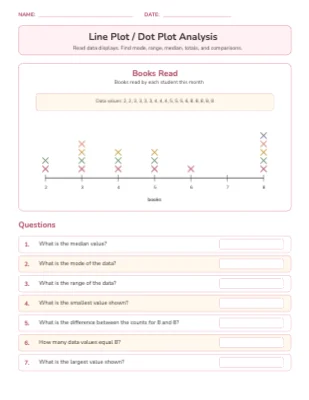
The Line Plot / Dot Plot Analysis generator creates data display worksheets where students read a pre-drawn line plot or dot plot and answer questions about mode, range, median, total, and data comparisons. Line plots are one of the key data representations in Grades 3–5 standards, and this generator produces unlimited unique datasets so students get fresh practice every time. Questions escalate from simple reading to multi-step interpretation, supporting a full range of learners. Comes with a complete answer key for fast grading.
Grade Levels
What's Included
Curriculum Standards
Represent and interpret data in line plots and solve comparison questions.
Draw a scaled picture graph and a scaled bar graph to represent a data set with several categories. Solve one- and …
Make a line plot to display a data set of measurements in fractions of a unit (1/2, 1/4, 1/8). Solve problems invol…
Make a line plot to display a data set of measurements in fractions of a unit (1/2, 1/4, 1/8). Use operations on fr…
Topics
Frequently Asked Questions
Is the Line Plot / Dot Plot Analysis worksheet generator free?+
Yes — sign up free and start generating Line Plot / Dot Plot Analysis worksheets right away. Paid plans add higher limits and premium features.
Does it include an answer key?+
Yes. Every Line Plot / Dot Plot Analysis worksheet is generated together with a matching answer key page, plus a teacher guide with objectives and extension ideas.
What grade levels is the Line Plot / Dot Plot Analysis generator for?+
It is designed for Grade 3 – Grade 5. You can adjust the difficulty and options to fit your students.
Can I customize the worksheets?+
Yes — every generated worksheet opens in the built-in editor, so you can change the title, instructions, fonts, colors, and layout before printing.
Can I make more than one version?+
Yes — each generate produces a fresh worksheet, so you can print unlimited unique versions for practice, homework, and assessments.