Count & Graph Worksheet Generator
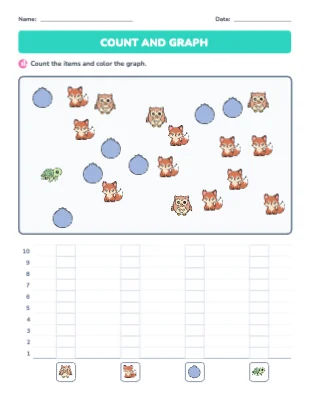
The Count & Graph generator creates worksheets where students count a set of pictured items by category and record the totals in a bar graph or tally chart. This two-stage activity — count then represent — introduces data literacy alongside basic counting from Pre-K through Grade 2. Students also answer simple comprehension questions about their completed graph. Answer key and teacher guide included.
Grade Levels
What's Included
Curriculum Standards
Measurement and Data
Statistics and Probability
Topics
Frequently Asked Questions
Is the Count & Graph worksheet generator free?+
Yes — sign up free and start generating Count & Graph worksheets right away. Paid plans add higher limits and premium features.
Does it include an answer key?+
Yes. Every Count & Graph worksheet is generated together with a matching answer key page, plus a teacher guide with objectives and extension ideas.
What grade levels is the Count & Graph generator for?+
It is designed for Pre-K – Grade 2. You can adjust the difficulty and options to fit your students.
Can I customize the worksheets?+
Yes — every generated worksheet opens in the built-in editor, so you can change the title, instructions, fonts, colors, and layout before printing.
Can I make more than one version?+
Yes — each generate produces a fresh worksheet, so you can print unlimited unique versions for practice, homework, and assessments.